The cryptocurrency market is known for its volatility, where prices can skyrocket one day and plummet the next. In such an unpredictable environment, traders often rely on technical analysis to make informed decisions. One of the key components of this analysis is recognizing bullish patterns, which signal that a cryptocurrency is about to experience an upward price movement. But what exactly are bullish patterns, and how can traders use them to their advantage? In this article, we’ll break down the most common bullish patterns in crypto, how to identify them, and why they’re essential for making successful trades.
What Are Bullish Patterns: The Basics
Bullish patterns in cryptocurrency are chart formations that suggest a shift from a downtrend to an uptrend. These patterns typically indicate that market sentiment is turning positive, often leading to a price increase. Recognizing these signals early on can give traders a valuable edge in predicting when to buy an asset before its price starts climbing. Some patterns form over a few days, while others take weeks or even months to develop, but the principle remains the same: they point to potential upward momentum.
The beauty of bullish patterns is that they can be applied to all timeframes, from short-term trades to long-term investments. Whether you’re a day trader or a hodler, understanding these signals can help you make more informed decisions. For example, a trader might spot a bullish reversal pattern after a significant price dip, providing an opportunity to buy low and sell high as the market recovers. These patterns are not just limited to Bitcoin or Ethereum—they’re useful across the entire crypto spectrum, from established coins to new tokens.
Most Common Bullish Patterns in Crypto
| Bullish Pattern | Description | Key Indicator |
|---|---|---|
| Inverse Head and Shoulders | Indicates a potential reversal after a downtrend, featuring three troughs with the middle being the deepest. | Break above the neckline (resistance) |
| Double Bottom | Forms a “W” shape when the price hits a low point twice. Signals an uptrend after breaking resistance. | Break above the resistance level |
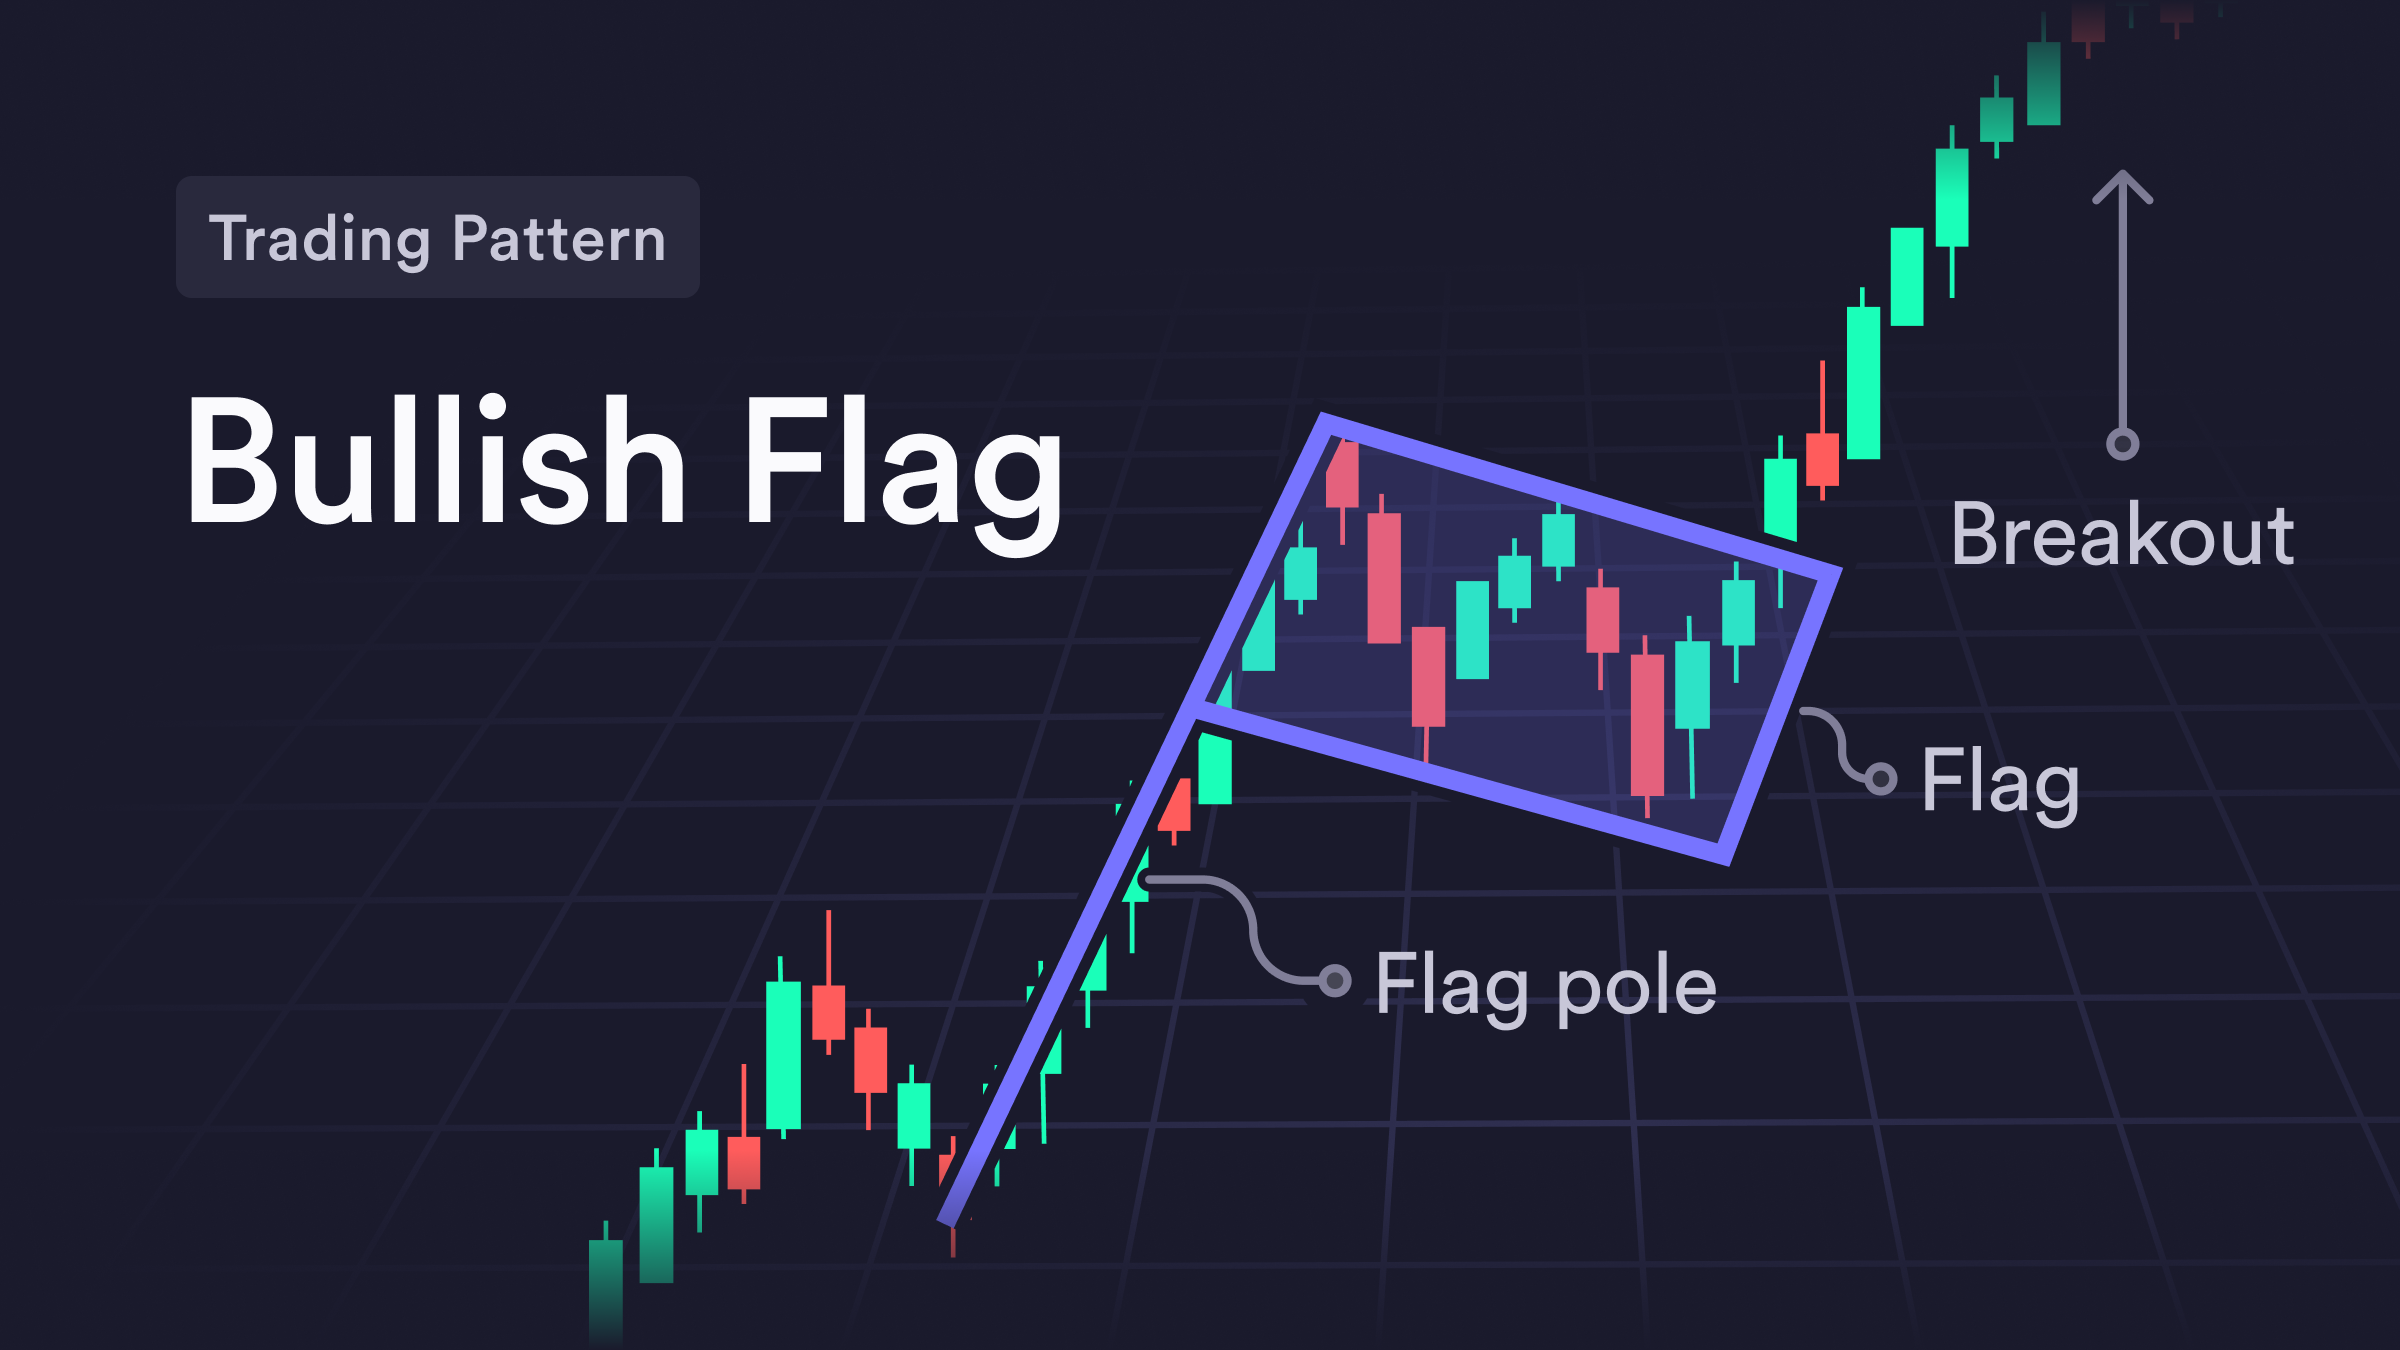
| Bullish Flag | Occurs after a strong upward move, where price consolidates in a narrow range. Indicates continuation of the uptrend. | Strong volume after consolidation |
Another frequently seen bullish pattern is the Double Bottom. As the name suggests, this formation occurs when a cryptocurrency’s price hits a low point twice, forming a “W” shape. After the second dip, if the price breaks above the resistance level between the two lows, it often indicates the beginning of an uptrend. This pattern highlights a significant support level and suggests that the bears have been unable to push the price lower, giving bulls the upper hand. The double bottom is a reliable indicator of a market reversal, especially when confirmed by an increase in trading volume.
Why Understanding Bullish Patterns is Crucial for Crypto Traders
Mastering bullish patterns gives crypto traders an edge by helping them time the market more effectively. In a space where news, hype, and fear can cause wild price swings, technical analysis offers a grounded approach to decision-making. For instance, spotting a Bullish Flag—a pattern where the price consolidates in a narrow range after a strong upward move—can signal a continuation of the uptrend. This allows traders to enter or re-enter the market before the next big rally, potentially maximizing profits.
Another key reason to understand bullish patterns is their versatility. They can be used in conjunction with other technical indicators, such as moving averages or the Relative Strength Index (RSI), to increase the accuracy of your predictions. Additionally, combining fundamental analysis with chart patterns can help traders confirm their trades. For example, positive news or developments related to a cryptocurrency project, such as a major partnership or technological upgrade, may coincide with a bullish pattern, reinforcing the likelihood of a price rise.
Additional Common Bullish Patterns
- Rounding Bottom: Indicates a gradual shift from a downtrend to an uptrend.
- Ascending Triangle: Forms when price moves between a flat resistance and an upward sloping support, signaling potential bullish continuation.
- Cup and Handle: A U-shaped pattern that indicates a consolidation period followed by an upward breakout.
In the dynamic world of cryptocurrency trading, identifying bullish patterns can be a game-changer for both novice and seasoned investors. These patterns serve as valuable signals for when the market may shift from a downtrend to an uptrend, offering prime opportunities to capitalize on price movements. From the Inverse Head and Shoulders to the Double Bottom, recognizing these patterns can help you time your entries and exits more effectively, ultimately boosting your chances of success. By combining technical analysis with a solid understanding of market sentiment and other indicators, traders can navigate the volatile crypto market with greater confidence.
References
- Investopedia: Understanding Bullish Patterns
- CoinMarketCap: Technical Analysis for Cryptocurrencies
- TradingView: Bullish Chart Patterns