Bitcoin, the world’s first and most popular cryptocurrency, has captured the attention of investors and traders worldwide due to its volatility and potential for substantial returns. Yet, for many, navigating its unpredictable price movements can feel like trying to predict the weather. Thankfully, technical analysis offers some clarity, and understanding key Bitcoin patterns can help traders anticipate future market moves. In this article, we’ll explore the most common Bitcoin trading patterns, how they work, and what they signal for both new and experienced traders.
The Most Common Bitcoin Patterns: Head and Shoulders & Double Tops/Bottoms
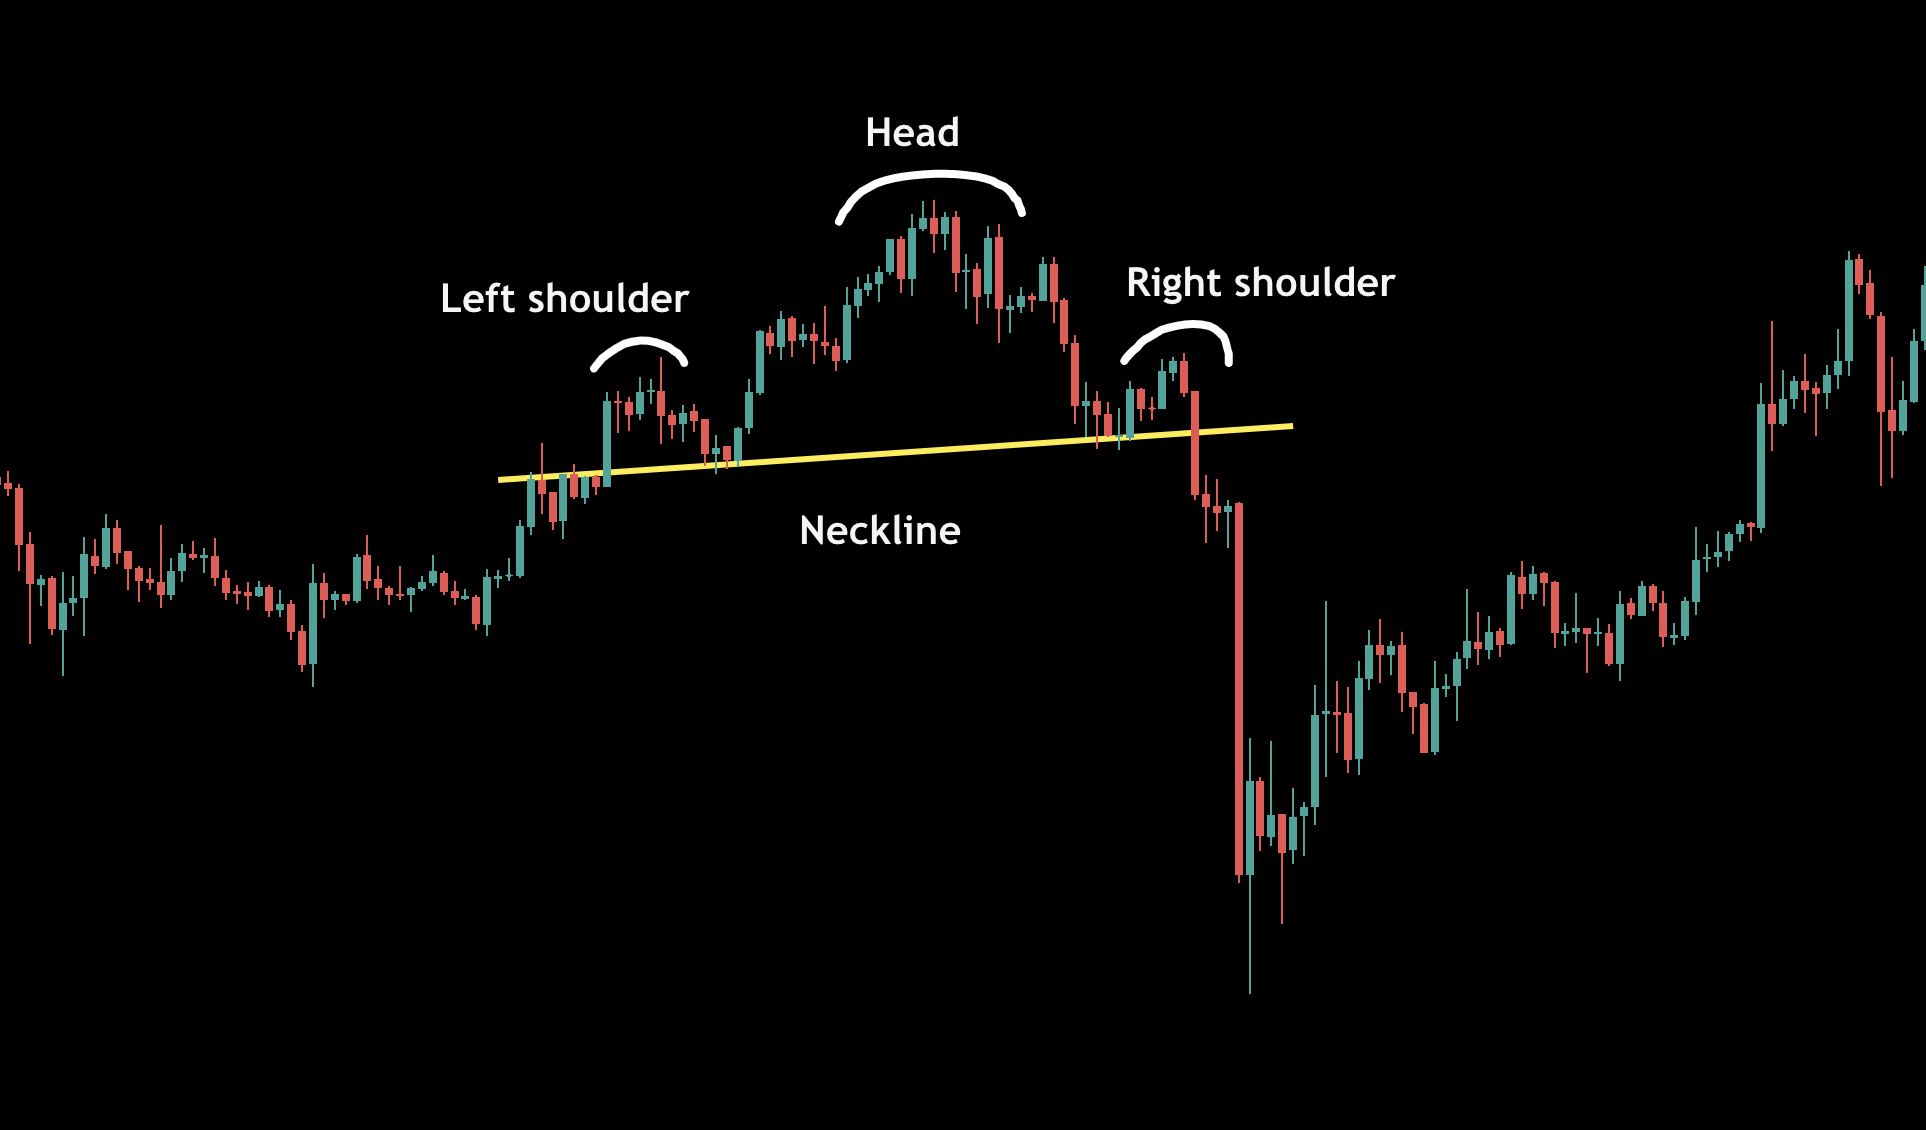
Among the many chart patterns traders rely on, the Head and Shoulders pattern is one of the most widely recognized in the Bitcoin trading world. This reversal pattern often signals that a bullish trend is nearing its end. It consists of three peaks: a high peak (the “head”) between two lower peaks (the “shoulders”). The appearance of this pattern often indicates that Bitcoin’s price is about to fall, offering a warning for traders to take profits or hedge their positions. Inverted versions of this pattern can also form, signaling a potential upward trend after a bearish period.
Key Characteristics of Head and Shoulders Pattern
| Characteristics | Description |
|---|---|
| Pattern Type | Reversal |
| Appearance | Three peaks (left shoulder, head, right shoulder) |
| Implication | Signals a potential price decline |
| Confirmation | Break below the neckline (the line connecting the lowest points) |
Another frequently observed pattern is the Double Top or Double Bottom. These formations are easy to spot and act as indicators of a trend reversal. A Double Top occurs when Bitcoin’s price peaks twice at the same level, suggesting that the upward momentum is exhausted and a drop is likely. On the flip side, a Double Bottom forms when the price hits the same low twice, signaling the potential for an upward rebound. Both patterns are reliable tools that help traders decide when to enter or exit the market based on Bitcoin’s price behavior.
| Pattern Type | Description | Action to Take |
|---|---|---|
| Double Top | Price peaks twice at the same level | Consider selling or shorting |
| Double Bottom | Price hits the same low twice | Consider buying |
Triangles and Flags: Continuation Patterns in Bitcoin Trading
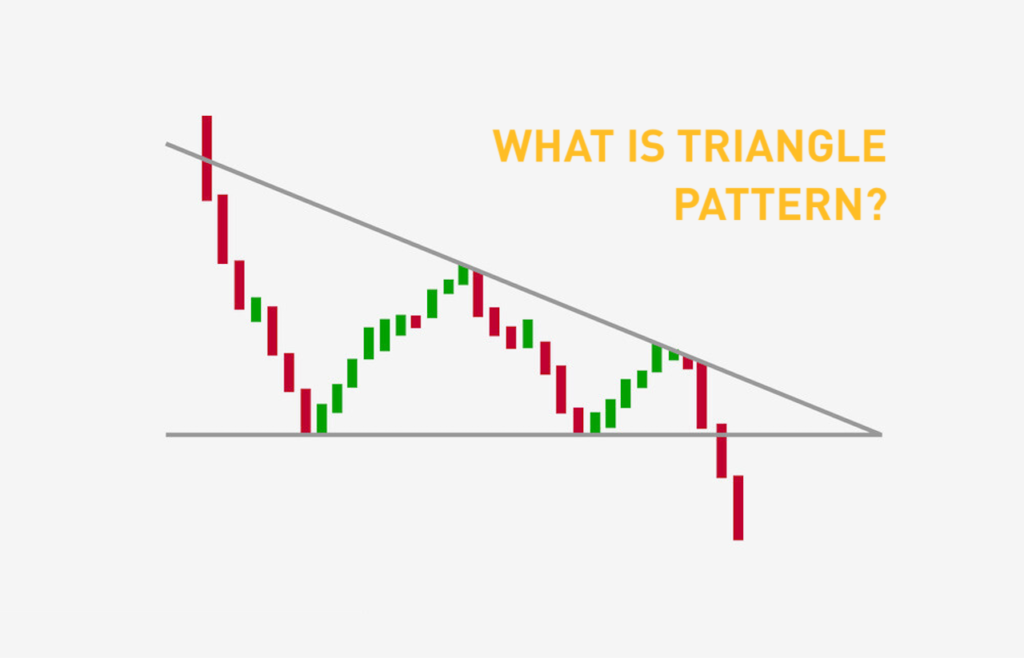
While some patterns signal reversals, others suggest that the existing trend will continue. One of the most common continuation patterns in Bitcoin trading is the Triangle. Triangles form when the price fluctuates within a narrowing range, creating either an ascending, descending, or symmetrical triangle shape. In a Symmetrical Triangle, Bitcoin’s price may bounce between converging trendlines, indicating that a breakout is imminent, but it’s uncertain which direction it will take. Traders watch closely for a clear break above or below the triangle to make their next move.
Common Triangle Types
- Ascending Triangle: Bullish pattern, often indicating a price breakout upwards.
- Descending Triangle: Bearish pattern, often indicating a price breakout downwards.
- Symmetrical Triangle: Indicates potential price breakout in either direction.
Another continuation pattern often seen is the Flag. This occurs when Bitcoin experiences a strong price movement, followed by a brief period of consolidation where the price moves sideways or slightly in the opposite direction. Flags are typically short-term patterns and are seen as a pause in the market before the trend continues. They are useful for traders who want to ride the momentum but need confirmation that the trend has room to run. These patterns help traders identify points where Bitcoin might break out of its consolidation phase and continue its trend.
Using Bitcoin Patterns with Technical Indicators
While recognizing Bitcoin patterns is essential, combining them with technical indicators like Moving Averages (MA) or the Relative Strength Index (RSI) can provide even more valuable insights. Moving Averages, for instance, smooth out price data to identify trends over a specific time period. If Bitcoin’s price breaks through a key moving average during a pattern formation, it can confirm the strength of the pattern and give traders confidence to act.
The Relative Strength Index is another crucial tool, which measures the speed and change of Bitcoin’s price movements. RSI helps traders assess whether Bitcoin is overbought or oversold. For example, if a Head and Shoulders pattern forms and the RSI is signaling that Bitcoin is overbought, traders might feel more confident that a price drop is imminent. Combining these technical indicators with chart patterns provides a comprehensive approach to predicting Bitcoin’s next move, offering traders a higher probability of success.
Understanding Bitcoin patterns is a powerful tool for anyone looking to trade or invest in the cryptocurrency market. From reversal patterns like Head and Shoulders to continuation signals like Triangles and Flags, these formations offer insight into Bitcoin’s price action and can provide a competitive edge. However, as with all forms of trading, these patterns are not foolproof and should be used in conjunction with other technical indicators and market research.
Mastering these patterns can help traders make more informed decisions, reduce risks, and capitalize on Bitcoin’s price fluctuations. As Bitcoin continues to mature, new patterns and trading strategies will undoubtedly emerge, making it essential for traders to stay adaptable and continue learning.
Additional Resources
- Investopedia: Technical Analysis
- CoinTelegraph: Understanding Bitcoin Trading Patterns
- CryptoCompare: A Guide to Trading Bitcoin Patterns